Winery Equipment Coverage: Keeping Your Crush Pads and Tanks Protected
Your winery’s equipment is the backbone of your operation, and damage to crush pads, tanks, or bottling lines can halt production for weeks. At ISU Insurance Solutions Group, we’ve seen firsthand how the right winery equipment coverage makes the difference between a minor setback and a business crisis.
Fire, flooding, and mechanical failures happen without warning. That’s why understanding your protection options matters now, before disaster strikes.
What Equipment Needs Protection at Your Winery
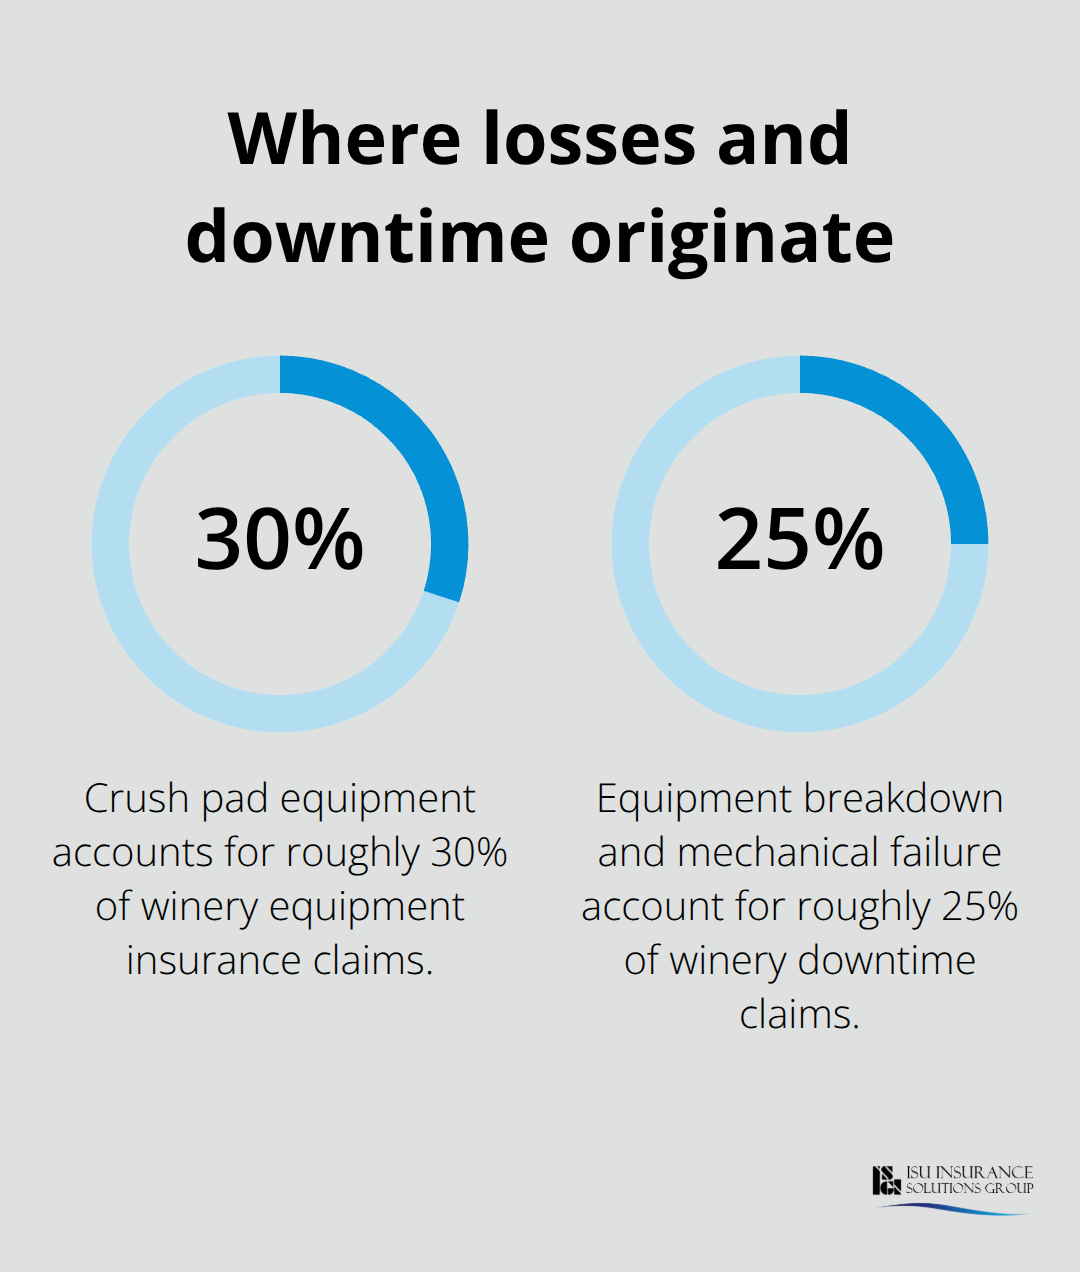
Your crush pad is where everything starts, and the equipment there faces constant stress from harvest pressure, weather exposure, and heavy use. Destemmer-crushers sit at the front of your line, handling thousands of pounds of fruit during peak season. These machines cost between $15,000 and $50,000 depending on throughput capacity, and a breakdown mid-harvest can cost you several tons of fruit per day in lost processing time. Sorting tables, conveyor systems, and pneumatic or mechanical presses follow downstream, each representing significant capital investment. According to industry data, crush pad equipment damage accounts for roughly 30 percent of winery equipment insurance claims, often because outdoor crush areas lack weather protection and operators don’t catch early mechanical wear.
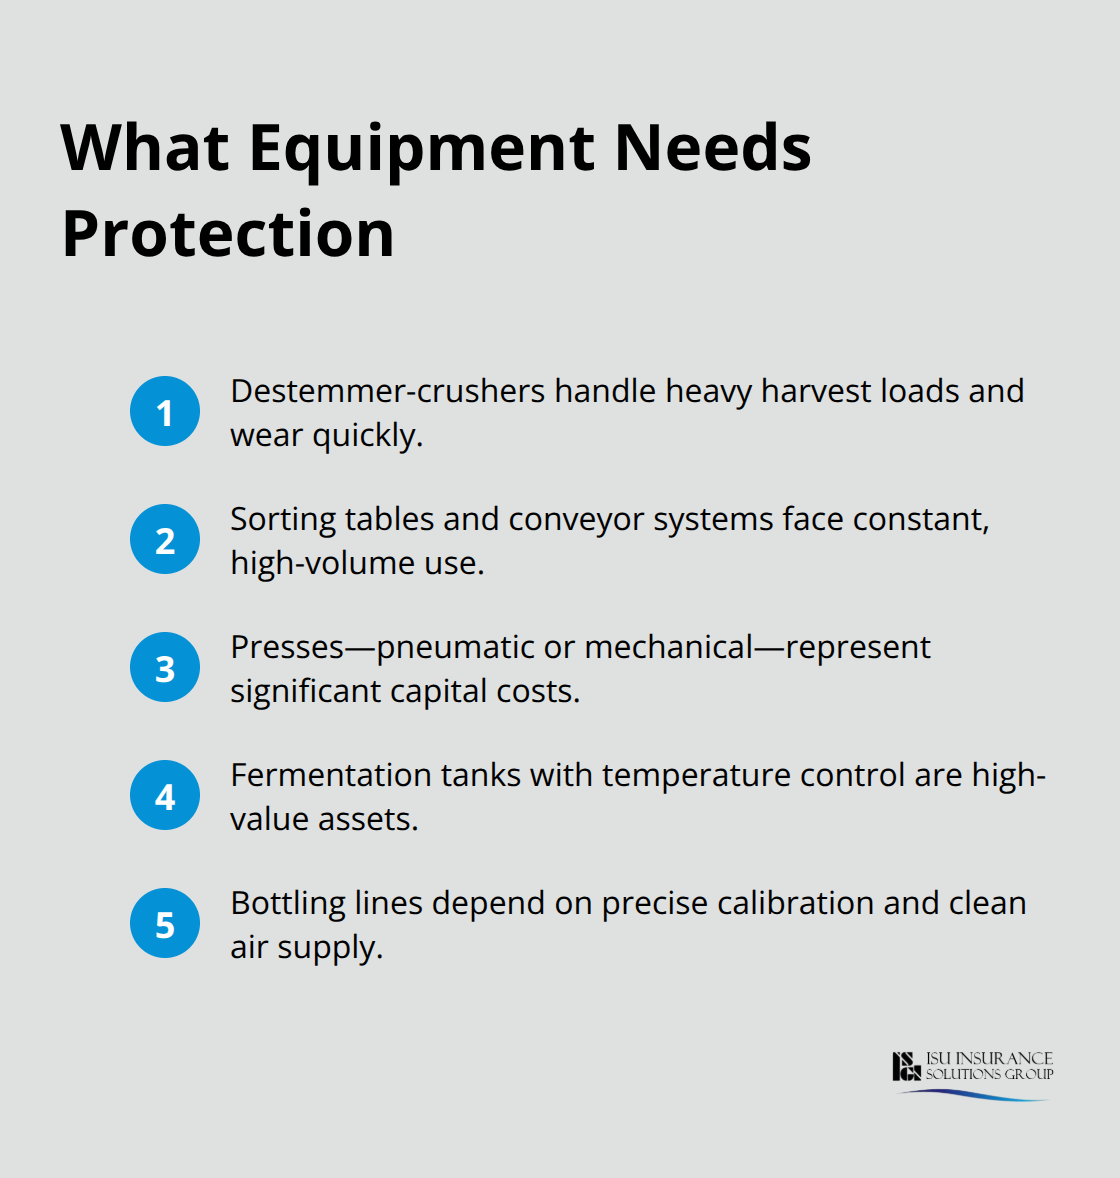
Fermentation tanks represent your largest single asset in most wineries. Jacketed stainless steel tanks with temperature control systems typically cost $3,000 to $8,000 per ton of capacity, and a mid-sized winery might have 50 to 200 tons of fermentation capacity on hand. Tank failures from rust, corrosion, or mechanical breakdown halt your entire production schedule and spoil thousands of gallons of wine in progress. Barrels add another layer of risk-wooden barrels cost $800 to $1,200 each and require humidity control between 70 and 80 percent to prevent stave cracking and seepage. Fire in a barrel room can destroy your entire aging inventory in minutes, and smoke damage alone can taint wine that took years to produce.
Bottling lines are equally critical but often overlooked in coverage discussions. A basic bottling setup with a filler, corker, and labeler runs $20,000 to $100,000 depending on speed and automation level. These machines depend on precise calibration and clean air supply-a single mechanical failure or compressed air system breakdown stops your ability to get finished product to market, directly blocking revenue during peak sales seasons.
Crush Pad Equipment Faces the Harshest Conditions
Your destemmer, crusher, and press sit outside or in partially covered areas where rain, frost, and temperature swings cause rapid deterioration. Moisture enters electrical controls and pump seals, rust forms on exposed metal surfaces, and freeze-thaw cycles crack castings. Many wineries discover equipment damage only when harvest arrives and they fire up machines that haven’t run in months.
Photograph and document every piece of crush pad equipment with serial numbers and purchase dates before coverage gaps form. Schedule a walk-through with your agent to identify which items are scheduled property-meaning they’re listed individually by value-versus blanket coverage. Newly acquired crush pad equipment often qualifies for automatic coverage up to $100,000 for the first 60 days, giving you a window to add permanent protection before that temporary window closes.
Fermentation and Storage Systems Require Continuous Protection
Tank failure during active fermentation means lost product, labor costs to clean and refill, and potential contamination of your next batch. Temperature control system failures in fermentation tanks can cause distortion and excess pressure from rising temperatures. Equipment breakdown coverage is optional but worth serious consideration if your tanks lack redundant cooling or backup power systems.
Many wineries overlook coverage for pumps, valves, hoses, and transfer lines-these cost $500 to $5,000 each, but damage to even one pump during transfer can spill thousands of gallons and contaminate your cellar floor. Barrels stored in humid cellars face water damage from roof leaks, sprinkler system failures, and foundation seepage. A single roof failure during harvest season can compromise dozens of barrels worth $50,000 or more in aging inventory.
Bottling Operations Demand Precision and Protection
Labeling machine failures rank high on the frustration list because they’re often quick electrical or mechanical fixes, but they stop your entire bottling line. A single day of bottling downtime at commercial speed means 3,000 to 5,000 bottles sitting unfinished in your warehouse. Equipment breakdown coverage for your filler, corker, and labeler pays for emergency repairs and lost production time during downtime.
Many wineries also benefit from coverage for portable or rented bottling equipment used during contract production or off-site events-this inland marine coverage protects equipment while it’s in transit or operating away from your main facility. Once you understand what equipment sits at risk and why, the next step involves identifying which specific perils threaten your operation most and how different coverage types address those threats.
Common Risks That Damage Winery Equipment
Fire Threatens Your Entire Inventory
Fire remains the single largest threat to winery operations, and the numbers are sobering. The National Fire Protection Association reports that wineries experience structure fires at rates significantly higher than general agricultural facilities, with crush pads and barrel rooms representing the highest-risk zones. A barrel room fire destroys decades of aging inventory in minutes, and smoke damage alone tarnishes wine that took years to produce, making it unsellable even if flames never touched a single barrel.
Crush pad fires typically start from equipment friction, electrical shorts in pump motors, or propane heaters used during cold harvest nights. Once fire spreads through wooden structures or ignites stored pallets and equipment, the damage cascades rapidly. The cost of replacing a burned-out fermentation tank or crush pad typically ranges from $25,000 to $150,000 depending on size and capacity, but the real loss comes from production halt and spoiled product.
Outdoor crush areas lack sprinkler protection in most wineries, meaning fire detection and suppression depend entirely on human response. Install heat-activated fire suppression systems directly above your press and destemmer, not just in the winery building. Many wineries also overlook smoke damage coverage-smoke penetrates stainless steel tanks and contaminates wine stored nearby, yet smoke remediation costs $10,000 to $50,000 and doesn’t guarantee product recovery.
Equipment Breakdown Halts Production Without Warning
Equipment breakdown and mechanical failure account for roughly 25 percent of winery downtime claims, according to industry risk assessments. Fermentation tank failures from corrosion or weld failure release thousands of gallons of wine and require weeks to repair or replace, while pump and valve failures during harvest season create immediate bottlenecks. Temperature control system failures on jacketed tanks cause pressure buildup and distortion-a single failed glycol loop during peak fermentation compromises your entire vintage.
Bottling line failures hit hardest during peak sales season when you’ve scheduled production weeks in advance; a labeler jam or filler calibration drift stops your entire line, costing $500 to $2,000 per day in lost throughput. Equipment breakdown coverage specifically addresses sudden mechanical and electrical failures, protecting against repair costs and lost production time when critical machines fail unexpectedly.
Water Damage Strikes From Multiple Sources
Water damage and flooding damage winery equipment through roof leaks, sprinkler system failures, foundation seepage, and burst hoses in cooling systems. A single roof leak above your barrel storage compromises dozens of barrels worth $50,000 or more, and water entering electrical control panels shorts out temperature monitoring systems and pump controls. Fermentation tanks sitting in low cellar areas flood during heavy rain or when sump pumps fail, requiring complete tank drainage, sanitation, and product loss assessment.
Hose failures in glycol cooling lines spray thousands of gallons of coolant across your cellar floor, damaging barrels and creating environmental cleanup costs. Document your crush pad layout, fermentation areas, and barrel storage locations on a site map, marking which equipment sits in flood-prone zones or lacks weather protection. Schedule equipment inspections before harvest-pressure-test hoses, verify pump seals, check tank welds for corrosion, and test cooling system thermostats under load conditions.
Understanding these three major threats-fire, mechanical failure, and water damage-shapes which coverage types matter most for your operation. The next section walks through how to assess your total equipment value and match it to the right protection limits.
Matching Coverage Limits to What You Actually Own
Start With a Complete Equipment Inventory
Walk your crush pad, cellar, and bottling area with a notepad or camera to document everything. List each major item-destemmer, press, fermentation tanks, cooling systems, pumps, bottling equipment-along with its purchase price, age, and current replacement cost. Crush pad equipment depreciates slower than you’d think because replacement parts and labor often cost more than the original machine; a $30,000 destemmer from ten years ago still costs $35,000 to $45,000 to replace today due to inflation and manufacturing complexity.
Fermentation tanks hold their value even better-stainless steel doesn’t rust quickly if maintained, so a 50-ton jacketed tank purchased for $250,000 five years ago typically costs $280,000 to $320,000 to replace now. Don’t use purchase price as your coverage limit; use current replacement cost, which is what you’ll actually spend to get back to work after equipment fails. Many wineries underestimate replacement costs by 20 to 30 percent because they forget to include installation labor, shipping from manufacturers, and equipment downtime during replacement.
Your crush pad alone probably contains $150,000 to $400,000 in equipment depending on whether you have a press, sorting table, and pneumatic systems, yet most policies start with blanket limits around $100,000 that leave you dramatically underinsured.
Set Deductibles Based on Your Cash Flow
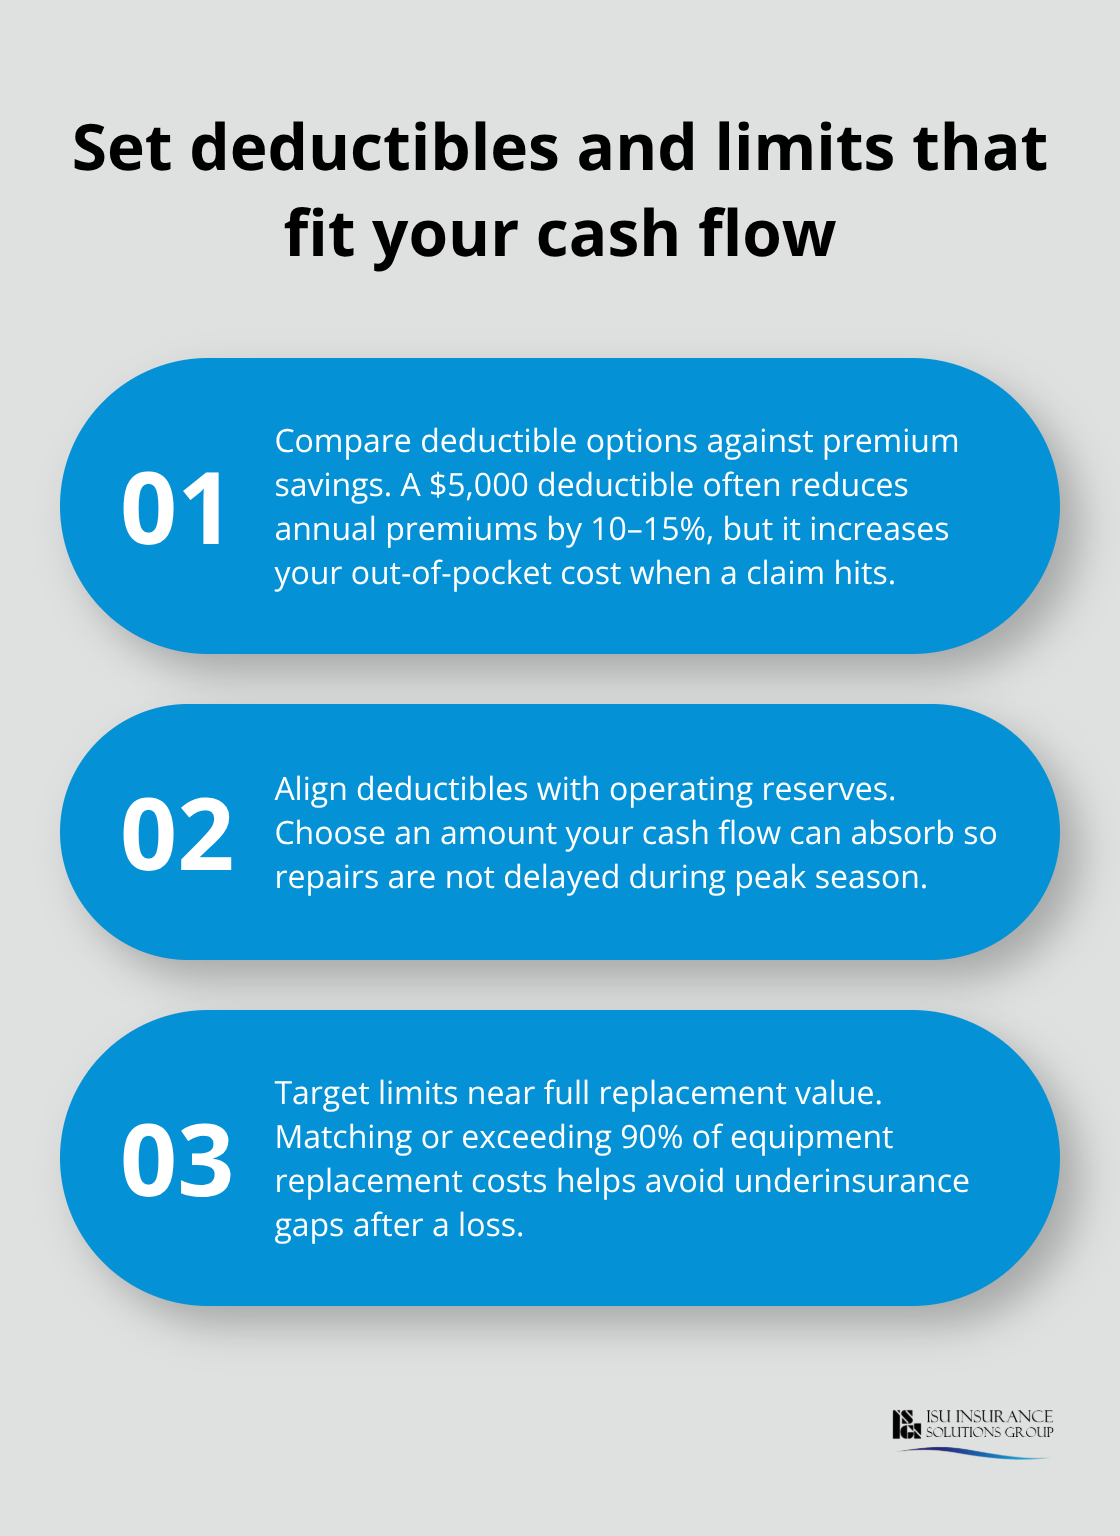
Work backwards from your risk tolerance to set deductibles and coverage limits. A $5,000 deductible saves you 10 to 15 percent on annual premiums compared to a $1,000 deductible, but during harvest when a pump failure costs you $2,000 per day in lost throughput, that $5,000 out-of-pocket hit stings hard.
Set deductibles at a level your cash flow can absorb without forcing you to delay repairs-if your winery has $50,000 in operating reserves, a $5,000 deductible makes sense; if you run tighter margins, stick with $1,000 to $2,500. Coverage limits should match or exceed 90 percent of your replacement equipment value, not 70 percent, because partial coverage forces you to absorb the gap yourself.
Choose Scheduled Property Coverage for High-Value Items
Many agents will push you toward lower limits to keep premiums down, but that’s a false economy that leaves you exposed to catastrophic loss. Scheduled property coverage-where you list individual high-value items like crushers, presses, and stainless steel tanks by name and value-costs slightly more than blanket coverage but protects you against underinsurance disputes when you file a claim.
Equipment breakdown coverage is optional, but if your fermentation tanks lack redundant cooling systems or your bottling line depends on a single pump with no backup, equipment breakdown coverage is worth the extra premium because a mechanical failure during peak season costs far more than the annual coverage fee.
Final Thoughts
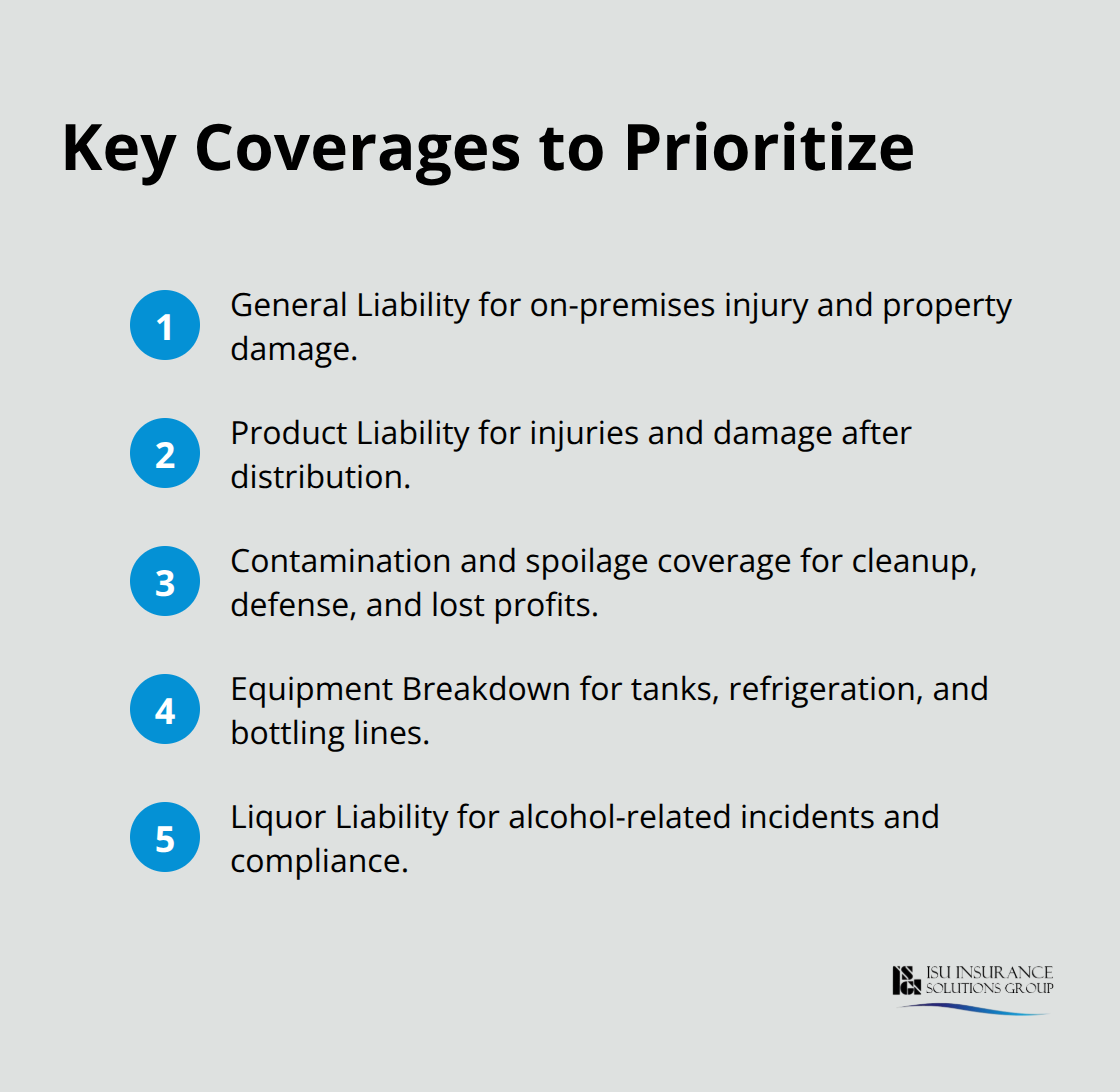
Equipment failures strike without warning, and your winery equipment coverage must reflect what you’d actually spend to restore operations after fire, mechanical breakdown, or water damage hits your crush pad or fermentation tanks. Scheduled property coverage for crushers, presses, and stainless steel tanks listed by individual value protects you against underinsurance disputes, while equipment breakdown protection covers your temperature control systems and bottling line when mechanical failure halts production during peak season. Set deductibles at a level your operating reserves can absorb without forcing repair delays, and aim for coverage limits that match or exceed 90 percent of your total replacement equipment value.
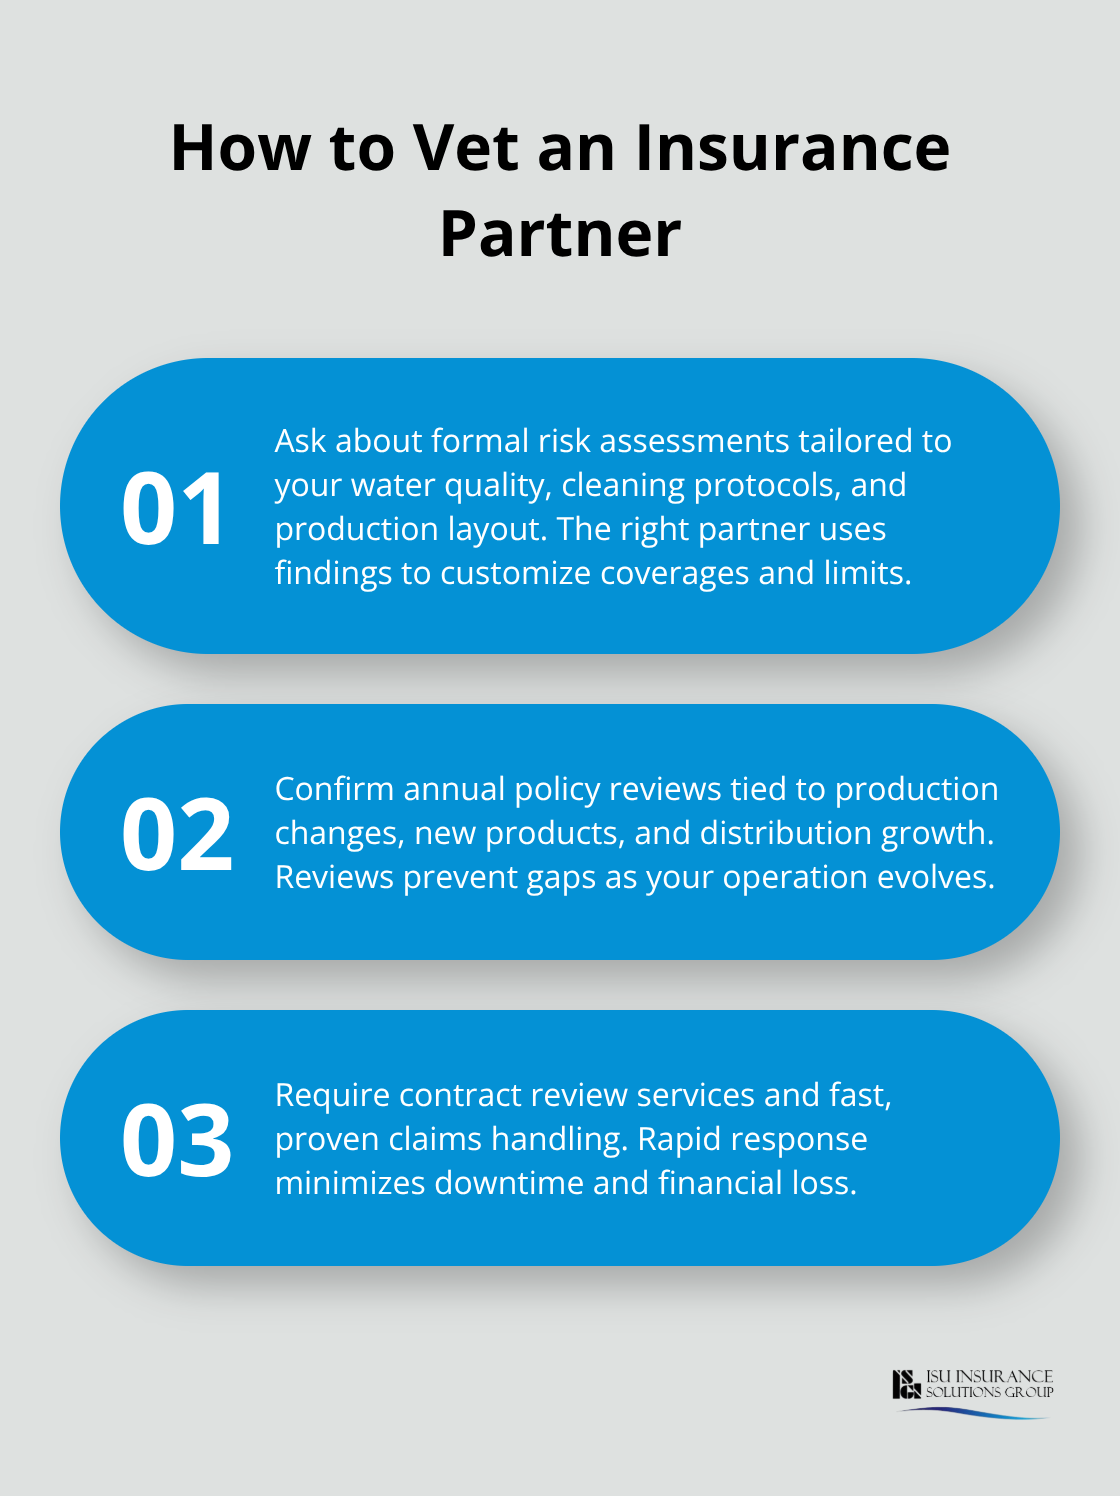
The agents at ISU Insurance Solutions Group understand winery operations because they work with crush pad layouts, fermentation schedules, and the specific equipment risks that general insurance carriers often miss. As a Woodinville-based independent agency serving Washington and Oregon since 1983, we partner with 20+ carriers to deliver multi-carrier quotes and personalized coverage tailored to your actual equipment inventory and production timeline. Rather than accepting a one-size-fits-all policy, work with an agent who walks your facility, documents your equipment, and builds protection around your specific vulnerabilities.
Contact ISU Insurance Solutions Group for a quote that reflects your total equipment value and production risks. The cost of proper winery equipment coverage is far smaller than the cost of downtime, spoiled product, or equipment replacement without insurance backing you up.
The information provided in this blog is for general informational purposes only and does not constitute legal, financial, or insurance advice. Coverage options, terms, and availability may vary. Please consult with a licensed professional for advice specific to your situation.